


In recent years, there have been major advances in terrestrial observation – accompanied by a dramatic increase in the need to measure Earth’s surface and atmosphere with greater precision. Cameras on the latest Earth observation satellites, such as WorldView 3, feature resolution of up to 0.5m. They are used for the images on Google Earth that are familiar to us all.
The quality of these pictures would have been unimaginable only a few years ago. A critical step in achieving these images has been the reduction of microvibrations on satellites.
Every satellite requires numerous drives, position controls, actuators and cryocoolers. These devices consist of mechanical components that cause vibrations when they operate. With increased camera resolution, these vibrations cause blurring of the images or ‘jitter’.
There are basically two paths to a solution – engineers either have to reduce microvibrations at source, or attenuate the microvibrations. Either way requires the measurement of microvibrations, which is done with the help of piezoelectric dynamometers.
Piezoelectric dynamometers
Microvibrations consist of extremely small accelerations of very low intensity. Measuring them is a challenging task, and methods for doing so have only become known in the last few years.
Piezoelectric force sensors and dynamometers are suited to this purpose and are in widespread use for measuring microvibrations. The very high resolutions achievable in these devices are advantageous because it becomes possible to measure dynamic force changes down to 0.01N, even if the object being measured weighs more than 10kg. The static weight can also be ‘eliminated’ by resetting the charge amplifier. Another factor is their high rigidity. This permits very high natural frequencies of 1,000Hz or more.
The dynamometer is mounted on a vibration-insulated table to ward off any structure-borne sound and external vibrations. External influences of this sort can distort measurements severely because the dynamometer, together with the mass of the object being measured, constitutes a large acceleration sensor. With correct setup, the interference signal is in the range of less than 0.01N and 0.003Nm (RMS; 3-350Hz).
The measurable frequency range is typically 1-350Hz. The lower limit is defined by the natural frequency of the vibration-insulated stone table. The upper limit is determined by the natural frequency of the dynamometer with the mass of the object being measured.
Correct mounting of the measured object and the dynamometer is critical for a good measurement result. It is important that the dynamometer as well as the measured object are mounted with plenty of bolts so as to ensure a clean mechanical coupling.
Sound and EMI (electro-magnetic interference) should also be avoided in or near the measurement setup. The dynamometer is connected to the charge amplifier with a special high-insulation cable. Data recording is handled by a laptop and an analog-to-digital convertor.
A waterfall chart is used to visualize the measured data, so targeted elimination of the causes of disruptive vibrations is possible.
Restriction on upper cut-off frequency
The maximum measurable frequency for microvibrations is currently about 350Hz. There has recently been increasing demand for the higher cut-off frequencies needed to measure larger objects.
Modern dynamometers consist of four three-component force sensors with a base plate and top plate, each made of steel. The dynamometer behaves like a second-order spring/mass system with a dominant natural frequency. Measurements must be taken well below the natural frequency.
Additional mass lowers the natural frequency, so a heavy object to be measured can have a major influence if the dynamometer is small. The dynamometer’s size also has a considerable effect on the natural frequency. The larger the dynamometer, the heavier the top plate will be – thereby reducing the natural frequency. This effect cannot be entirely compensated by using more rigid sensors.
There is also a trend emerging toward measuring higher frequencies, which makes it possible to reduce microvibrations even further.
Another trend is for larger dynamometers. The testing of complete subsystems and small satellites require larger dynamometers. However, the maximum size of dynamometers had been reached with existing materials. Further enlargements were only possible with a large investment in R&D.
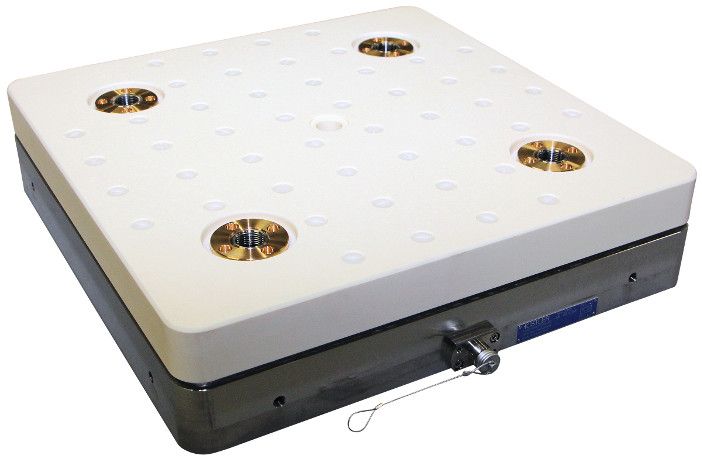
Dynamometers with ceramic top plates
As shown above, the dynamometer’s size has a critical impact on natural frequency. The heavy weight of the top plate is especially unfavorable in this regard. A search for new materials for the top plate at Kistler revealed that ceramics offer highly advantageous properties for dynamometers, including a low specific gravity and a high modulus of elasticity. Low tensile strength and low thermal expansion were found to be the drawbacks of ceramics.
Finite element modeling (FEM) calculations showed that the natural frequency is increased by 40% with the same sized dynamometer, enabling significant improvements to be achieved when measuring microvibrations. The lower strength can be accepted because the forces and loads in microvibration measurement are very small. To allow correct mounting of the dynamometer, the steel base plate was retained.
Low thermal expansion proved to be a problem. Despite the FEM calculation, full validation of this behavior was not possible. An extended investigation with experimental specimens was needed to show that the difference in thermal expansion between the steel base plate made of steel and the Al2O3 top plate does not lead to fractures, thanks to the special structural design.
By using ceramic instead of steel for the top plate, it has been possible to manufacture a dynamometer specifically for measuring microvibrations. Thanks to significantly increased rigidity and a lower weight for the top plate, natural frequency could be increased by 40%. This allows microvibration measurements at higher frequencies. In parallel, the size of the dynamometer could be increased to accept complete subsystems or small satellites.
Sentinel 4 satellite
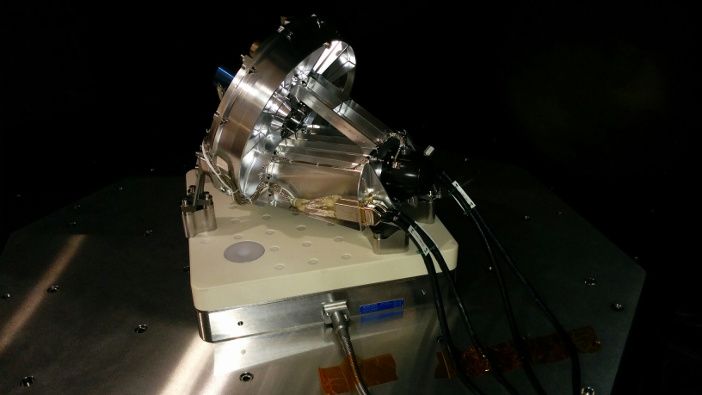
A great example of the use of a piezoelectric dynamometer in a testing application is the recent development of the Sentinel 4 (Ultraviolet Visible Near-infrared) UVN satellite at the Centre Spatial de Liège (CSL) in Belgium.
The Sentinel 4 satellite, which is part of the EU’s Copernicus program, will provide information on the atmosphere by monitoring air quality, stratospheric ozone, solar radiation, and the climate.
Engineers at CSL required a dynamometer with a natural frequency of less than 1,500Hz to characterize the optical calibration system for of the Sentinel 4. They selected Dynamometer type Z21492 with a ceramic top plate because of its large dimensions and high natural frequency. The dynamometer is set up on an insulated stone table and in a sound-insulated area.
The next step will be validation measurements with subassem- blies for Sentinel -4 satellite. After completion of validation, the CSL will be able to offer the space community a superior test facility for characterization of microvibration measurements down to a noise floor of 0.01mN (narrow band noise ΔF=1Hz).
Written by Marine Dumont, business development manager, Kistler Instruments


