


Data is one of the foundational elements of testing from which analysis is done and conclusions made. There are many different types of testing used in aerospace, but there is a common challenge. Whether it is structural or vibration testing on the ground, NDT, flight test or any of the other many types, engineers must analyze and interpret vast amounts of data quickly and effectively.
Fortunately, as the amount of data available to engineers has increased, new tools to visualize and analyze datasets have been created. Several of these software tools are cloud-based and equipment vendor-independent. They provide engineers with the means to see relationships and draw conclusions from data that would otherwise be difficult or impossible to make. Furthermore data analysis tools are getting better – and easier to access and use – all the time.
Data to information
Data visualization translates raw data into plots, charts and graphics that help people more easily identify patterns, trends, and outliers in data. It helps turn data into actionable information.
In the past, only bespoke software provided by the test equipment suppliers could be used for data analysis. But during the last decade, advances in IT such as cloud-based apps and low-coding concepts have enabled the creation of data visualization tools and programming languages that are increasingly finding uses in aerospace.
One of the leading data visualization tools is Grafana, a free to download, open source platform with paid tiers. Launched in 2014, Grafana has evolved from being a data monitoring solution into an observability platform.
The concept of observability may be unfamiliar to people outside of IT, but it has its roots in control engineering. Richi Hartmann, communities manager for Grafana says, “There is overlap between monitoring and observability, but the latter goes a step further. Observability is defined as a measure by which, to an extent, you can determine the internal state of a system, just by looking at its outputs.”
Hartmann uses the example of a cockpit to illustrate Grafana’s utility. He says, “Aircraft produce a lot of data, but you only have a limited amount of space in your cockpit. Grafana can give you a functionally infinite amount of screen space to display information. It’s a massive strength, but in the case of aircraft, you would need to balance that by considering safety and human factors.”
After a test flight that used Grafana Hartmann says engineers can correlate information in different ways and have a better understanding of results by visualization. “You can only observe and start to build an understanding of something if you can see it. Humans understand mainly through seeing,” he says. “The ability to communicate data visually is something I am passionate about.”

Democratizing data
Grafana claims to be simple enough that its single file can be downloaded and a user can create a dashboard in a single lunch hour. A baseline understanding of engineering and computers will help the process: “We have a really low entrance bar for success. You need the data, any SQL or CSV file or Google Sheet – we support lots of formats. Or you use our streaming API for live data, although I always recommend storing it in a persistent database too,” says Hartmann.
“The chances are if data is valuable enough to view once, you will want to look at it again.”
There are no specific certifications or regulations that affect Grafana, and it is already being used by aircraft OEMs including Airbus and Boeing, launch and spacecraft developers including NASA, SpaceX and JAXA, and many more in the supply chain, as well as airlines and fleet operators.
Grafana does not know exactly who is using their software and what for, because the software is open source. Users contribute to online community groups to support each other and exchange the best dashboard. There is a growing aerospace group. “Grafana’s superpower is to democratize data. Anyone can build a dashboard suited to their own use case. If it is a good use case, others can take it and use it too. If it is not successful you just throw it away – it can take minutes to create a dashboard and there is no cost,” says Hartmann.
Open source software has advantages, but some might question its suitability in aerospace, particularly in defense applications. Hartmann strongly disputes that open source means software is less secure: “We are used by every single major bank, stock exchanges, the US military and quite a few other entities who have very little time for bad security,” he says. “But fundamentally security is about reliability, it is a bug that someone is controlling to their own advantage. We have a great security team and disclosure programs.”
Major industry studies conclude that open source software has fewer bugs and vulnerabilities than closed source, he adds. But it’s not the software’s security or open source nature to which he attributes Grafana’s growth, but its “big tent approach”.
“We do not restrict our user’s ability to use our competitor’s products, instead we actively work with our competitors to ensure compatibility. We deliberately don’t play games with our users around integration.”
Sky high
The Dollar Per Foot Challenge is an annual competition in the USA and Canada hosted by the Friends of Amateur Rocketry. It rewards teams of students with a dollar for every foot of altitude achieved, for a single-stage, liquid-fueled rocket that they develop and launch.
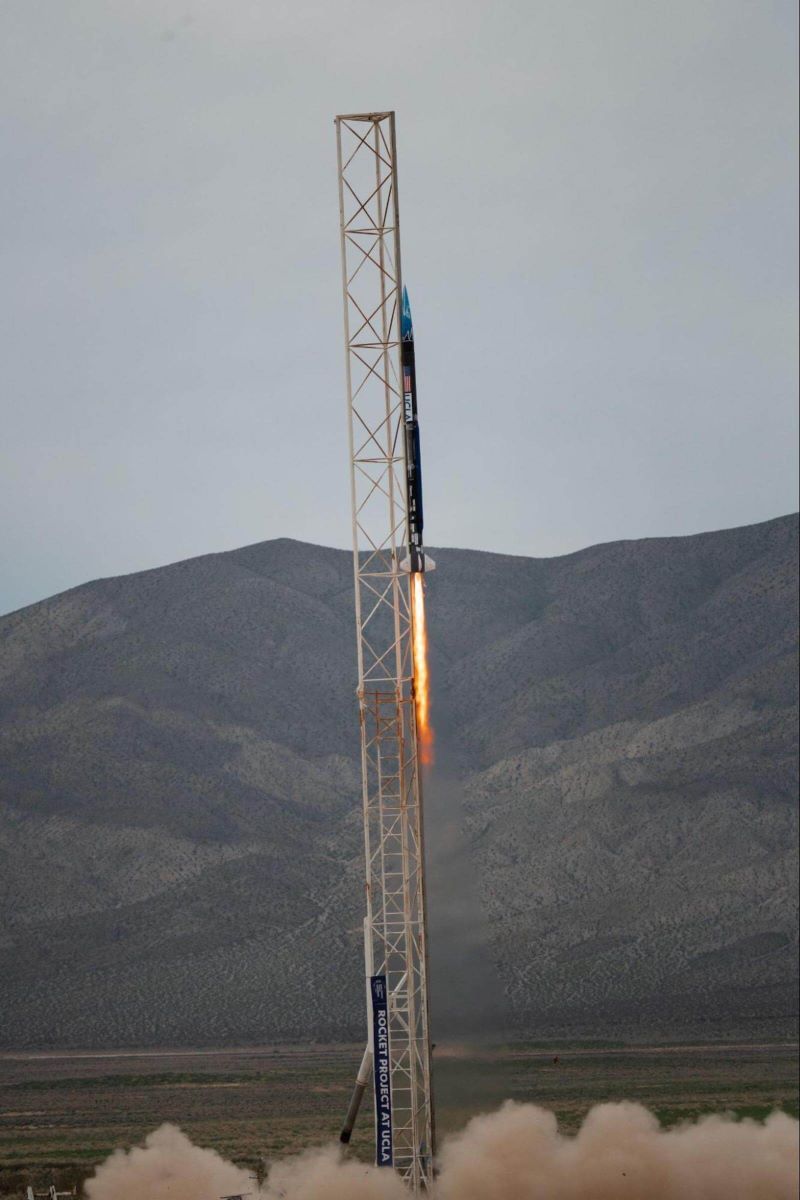
Last year a 40-strong team from the University of California Los Angeles (UCLA) in the USA achieved the collegiate world record for highest liquid rocket altitude by sending their rocket, Phoenix to an altitude of 22,000ft for the Challenge.
Team Phoenix comprised of three sub-teams: electronics, vehicle engineering and propulsion. Philip Do, a computer science and engineering student at UCLA, led the electronics sub-team.
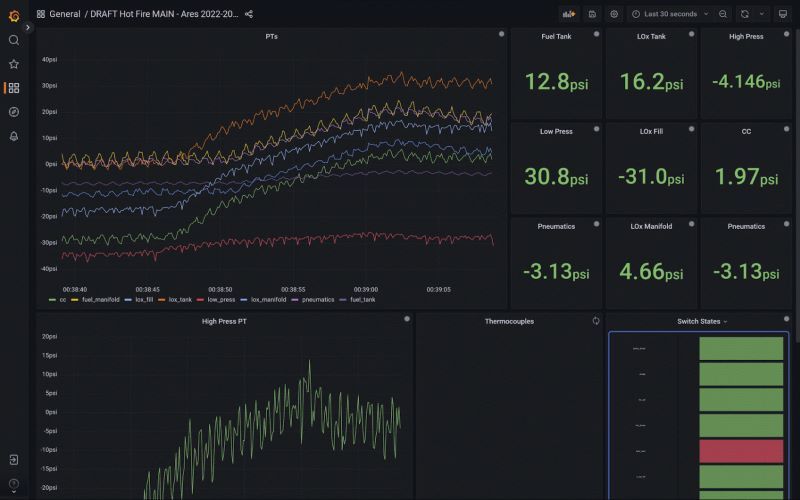
The team used Grafana from the first stage of testing the rocket – cold flow – before moving on to hot fire testing and launch. A Grafana-produced dashboard was used to view and record voltage readings from pressure transducers, thermocouples and other sensors to calibrate them and ensure they were not loose.
“During cold flow testing we release liquid nitrogen and observe it going through the pipes. We read voltages and pressures to check connections for leaks and loose components,” says Do. “Grafana tells us visually if voltages are all over the place or if there are pressure drops, in which case we can carry out a fix.”
Hot fire testing was done in the Mojave Desert. Once the rocket was on its stand, the team checked connections and components before firing with different fuel mixes to record the thrust generated. “Grafana let us view and record thrust data, and check things like the altimeter. Also, we could share the data easily using a web server. You can change what data to view and interpret in different ways using graphs instead of raw numbers,” says Do.
The dashboard is again used for procedural checks during launch setup to ensure everything works. “We watched the graphs live to see if there are leaks,” says Do.
During the launch and 11-second flight the data was telemetered through the dashboard. Post flight it was merged with data recovered from a recording onboard the rocket to fill in gaps, such as was experienced when the rocket when supersonic.
“Without Grafana this project would have been so much harder,” says Do. “In the past we had these massive spreadsheets – there is all this data recorded at thousands of times per second.
“Just being able to debug in the way we do saves a lot of time. Without it we would have to hardwire components to different devices and sift through printouts of raw voltages looking for discrepancies. We would not be able to catch all the smaller leaks and see the data in real-time. And it would take a lot longer to parse and analyze all the data.”
Do adds that Grafana simplifies data analysis – its user interface does not require extensive knowledge of computer science and coding to set up. This year, he is a senior adviser to a new group of students developing a rocket that is attempting to go higher and experimenting with different fuels, such as methane.
A niche approach
In contrast to Grafana’s big tent approach, Marple is a data visualization and analytics tool specifically for test engineers in the aerospace and automotive sectors. The software was launched four years ago and Marple is being used by teams at fixed-wing aircraft OEMs and eVTOL developers in France and Germany.
Carlos Lagoa, business development manager at Marple says there are three main ways of analyzing data from testing. The first is to write a script. “Even though scripting is powerful in the beginning, it can become messy and is not great for team collaboration,” he says. “It is more of a general tool. Once things get big a script can be difficult to use and prone to crashing. Furthermore, we and our users are engineers, not programmers. We want plug-and-play solutions that help us with engineering. We do not want to spend lots of time coding.
The second method is vendor-provided tools or legacy solutions from larger companies. “These, like scripting tools, are great for specific use cases, but are not very flexible, and more often than not are expensive, bloated and hard to use,” he says.
The third way is the most recently devised and is to use what Lagoa terms a generic web-based tool that combines scripting and outputs a dashboard of results. Examples of this include Grafana, Plotly and RStudio.
Mix and match
According to Lagoa, Marple is a middle ground that combines the best parts of the three approaches with a focus on enabling engineering-specific workflows and remote working. He says, “Crucially, there is no more waiting around for data to upload. Results are uploaded once and the data can then be accessed from different locations.
“Marple can also handle datasets at rates of up to 1GHz and cope with plotting up to 100GB of data, with millions of data points possible and lots of different calculations on top of your data to further plot. We support all different file formats, such as Matlab, binary files from dataloggers, CANBUS, and hdf. Our flexibility is key and if there is an unusual requirement we will accommodate it.”
Marple has prioritized usability and simplicity in the user interface for features. Test results can be compared and its report function can automate testing based on a user’s pass/fail criteria.
“Marple will support your multidisciplinary data analysis more than any vendor-supplied software will, faster and more effectively with support for different file types. It is being constantly updated and improved – the next version will bring improvements to the reporting function for example,” says Lagoa.
Whether you are a data analysis expert or a novice in the area, data visualization tools are available at no to relatively little cost with features and usability that is improving fast. Increasingly, it makes sense to employ software to do the heavy lifting when creating data visualizations and leave the engineers to do more engineering.
Coding: How low can you go?
Low-code is a way to develop software using a graphical user interface. It enables those with little to no experience of programming to create software or apps.
Data visualization software such as Grafana and Plotly are examples of low-code platforms. They essentially provide a way for those with no coding experience to efficiently produce bespoke software suited to their needs rapidly and more easily.
Low-code takes a visual approach that will normally involve dragging and dropping coding elements of the platform and automates aspects of the software development process. Sometimes there is no hand coding needed at all.
Web-based Data visualization tools
Plotly
Plotly is data visualization software for building, testing and deploying interactive web apps, charts and graphs in any programming language. It is open source with pricing at enterprise levels.
RStudio
RStudio is an integrated development environment for R, an open source programming language for statistical computing and graphics.
Grafana
Grafana is an open source analytics and interactive visualization web application. It provides charts, graphs, and alerts when connected to supported data sources.
Marple
This software platform specializes in the processing, visualisation and analysis of large time series data sets typically used in engineering
and R&D.


